-
Cryptocurrencies plunged hard after the latest Federal Reserve decision.
-
Bitcoin dropped below the key support levels at $25,300 and $25,000.
-
XRP has formed a double-top pattern on the daily chart.
Cryptocurrency prices dipped sharply this week amid significant monetary policy and regulatory concerns. Bitcoin crashed below the important support at $25,000 while most altcoins erased their 2023 gains. This sell-off accelerated after the Federal Reserve pointed to two more rate hikes later this year. In this article, we will explain what to expect in XRP, Hedera Hashgraph, and Stacks.
XRP price prediction
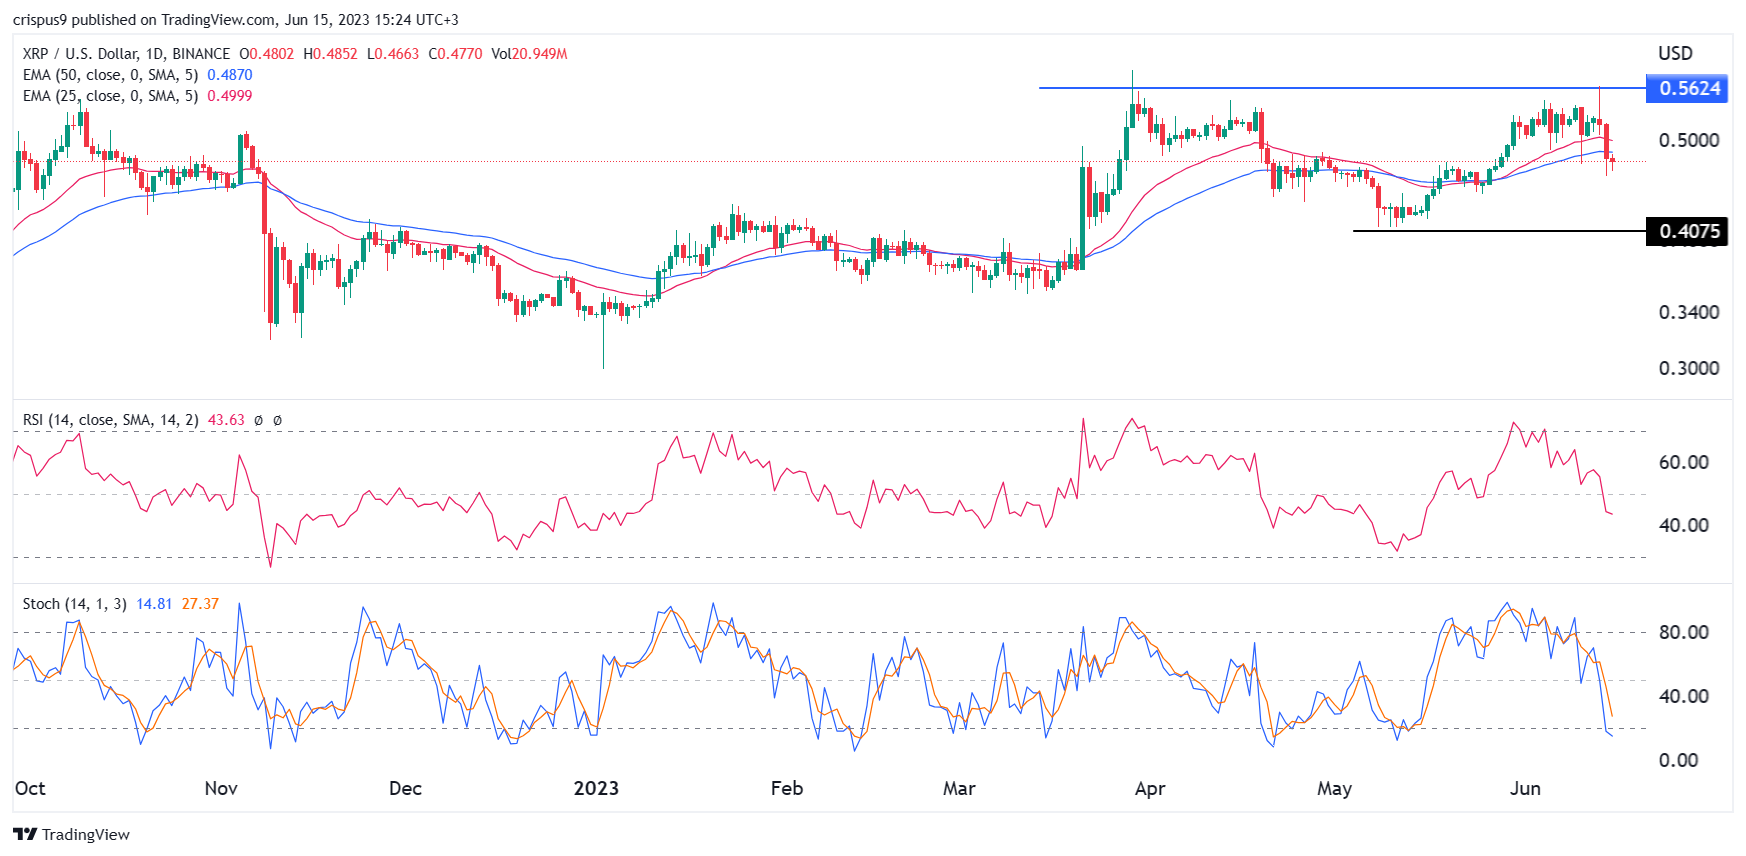
The XRP price drifted downwards this week after it jumped to a high of $0.5624. Its highest point was an important level since it was also the year-to-date high. This means that the coin has formed a double-top pattern, which is usually a bearish signal. The neckline of this price is at $0.4075, the lowest level on May 11.
At the same time, Ripple price managed to cross the 25-day and 50-day exponential moving averages, signaling that bears are gaining traction. The Relative Strength Index (RSI) crossed the key level st 50 while one line of the Stochastic Oscillator indicator dropped below the oversold level. XRP price also formed a small shooting star pattern.
Therefore, the outlook of Ripple is bearish, with the next level to watch being at the neckline of the double-bottom pattern at $0.4075.
How to buy XRP
inv-news-table coins=”XRP” limit=”2″]
Hedera Hashgraph price prediction
Hedera Hashgraph is a major blockchain project that seeks to become a good and faster alternative to Ethereum. It is faster, cheaper, and governed by leading companies like Google, IBM, and LG. Like other cryptocurrencies, the HBAR price has been in a strong downward trend in the past few months. It has erased about 40% from its highest level this year.
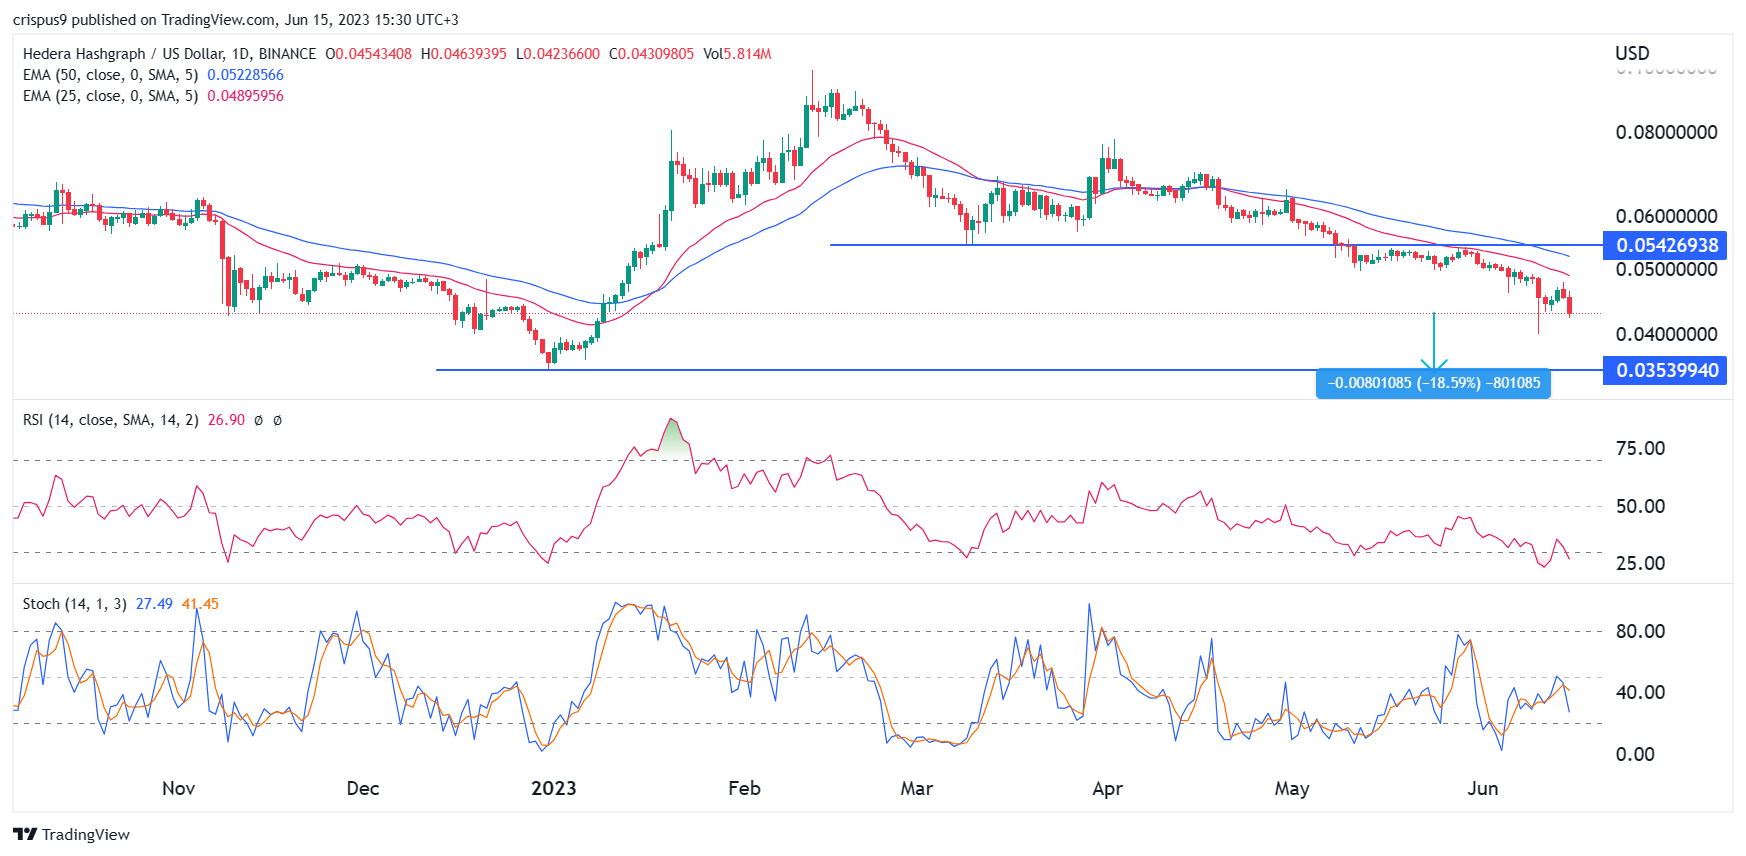
HBAR price has dropped below the important support level at $0.0542, the lowest level on March 10th. The token has moved below the 25-period and 50-period moving averages. At the same time, the Relative Strength Index (RSI) has continued falling. Therefore, there is a likelihood that the coin will continue falling as sellers target the next key support level at $0.035, which is about 18.5% below the current level.
How to buy Hedera Hashgraph
inv-news-table coins=”HBAR” limit=”2″]
Stacks price prediction
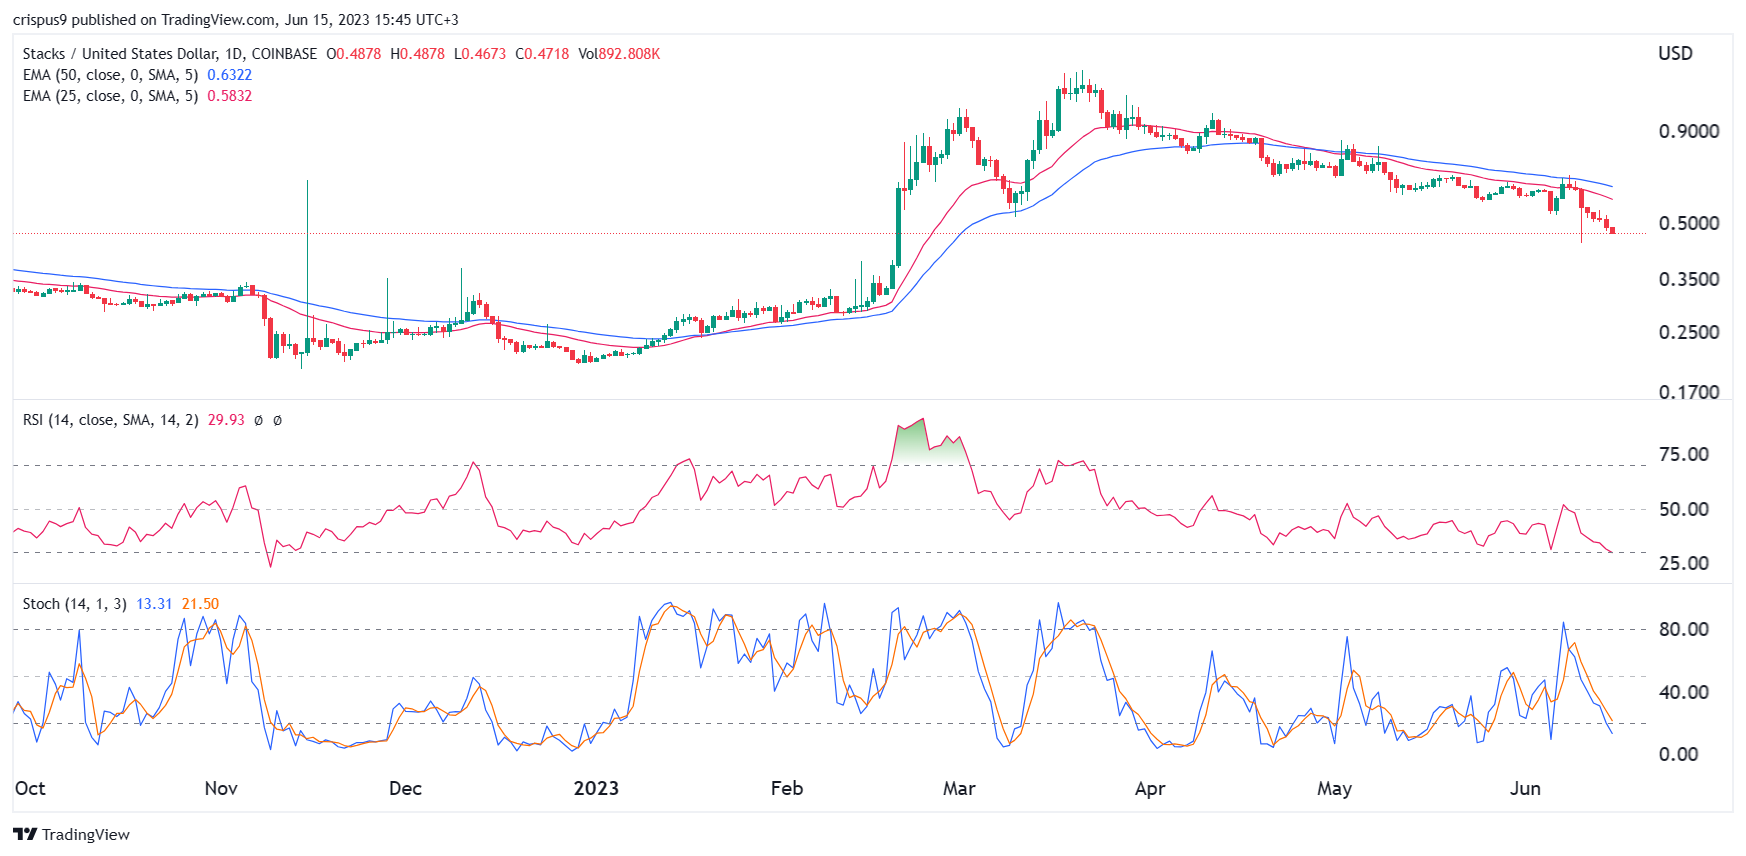
Stacks price has been in a strong bearish trend despite the rising interest of Bitcoin development. STX managed to move below the lower side of the descending channel shown in orange. At the same time, the coin has dropped below the 25-day and 50-day EMA. On the daily chart, it has moved below the 61.8% Fibonacci Retracement level.
Stacks has also moved below the psychological level of $0.50. Therefore, there is a likelihood that the coin will continue falling as sellers target the next level at $0.35.
How to buy Stacks
inv-news-table coins=”STX” limit=”2″]
Share this article
Categories
Tags
https://coinjournal.net/news/crypto-price-prediction-xrp-hedera-hashgraph-stacks/


 BTC-USD
  ETH-USD
  LTC-USD
  XRP-USD