Dash (DASH) is likely to break above $120 in the next few sessions to see bulls target a fresh upside towards $140
Dash (DASH) has traded higher over the past three days and could record a fourth consecutive green candle to boost the bulls’ case for more gains. This comes after selling pressure saw bears push prices from a 7-day high of $134 to lows of $94 this past week.
Bulls were able to reclaim control over the weekend and have pushed higher, although seller congestion around $110 has somewhat stalled progress during early sessions this Monday.
DASH/USD
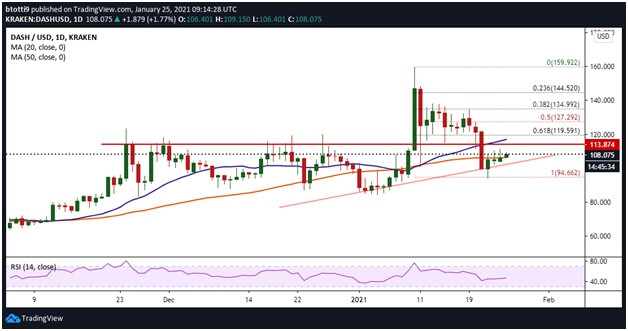
The short-term technical outlook for Dash suggests bulls have the upper hand as long as the price stays above $105. The price level offers a solid support zone, with a nearby cushion above it at the 50-SMA ($106). Below it there’s a month-long ascending trendline that has prevented sellers from taking DASH/USD under $100 for the past four days.
DASH/USD daily chart. Source: TradingView
Further optimism for buyers is supported by the golden crossover of the 20 over 50 simple moving average on the daily chart. The 20-SMA curve is extending higher and widening the gap over the 50-SMA to suggest the uptrend is strengthening.
Currently, there’s overhead resistance provided by a previous horizontal line at $113, above which increased buying could push DASH price to the 20-SMA ($117). Above this price level, bulls face strong resistance at $120, which is just above the 0.618 Fibonacci retracement level ($119.59) of the downswing from $159 high to $94 low.
If bulls succeed in breaking above and sustaining momentum above $120, the next hurdle is at $127 (0.5 Fib level) and $134 (0.382 Fibonacci level).
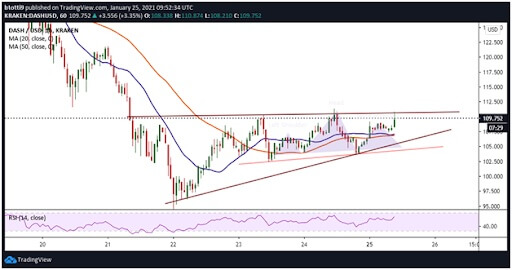
DASH/USD hourly chart. Source: TradingView
On the hourly chart, DASH/USD looks to have invalidated a potential head-and-shoulders pattern with a neckline around $104.
If prices move higher, bulls could break past the upper trendline of an ascending triangle pattern with a barrier at $110. From here, legitimate targets are at $113 and $120, which are likely to be the main hurdles to the upside to $140.
The positive divergence of the RSI suggests bulls have the upper hand at the moment.
On the contrary, a downward move could see DASH/USD retreat to the 20-SMA ($106) and 50-SMA ($107) on the hourly chart. Any losses beyond this could take Dash price to the robust support zone around $105. Recent lows of $94 provide further attraction to shorts near term.
https://coinjournal.net/news/dash-targets-fresh-rally-to-140-amid-a-growing-bullish-scenario/


 BTC-USD
  ETH-USD
  LTC-USD
  XRP-USD