Tezos could jump 30% within the next few sessions if its price continues to rally above a major supply zone that has recently thwarted upside gains
Tezos’ price is looking to break to $2.80, and XTZ could join the altcoin party with a massive spike if bulls rally above $3.00. While the cryptocurrency currently trades near a major reload zone, a breakout will likely push XTZ/USD nearly 30% towards $3.55.
The cryptocurrency’s value has increased by about 12% over the past 24 hours and is currently trading at $2.74 at the time of writing. More than $468 million worth of XTZ has been traded in this period, pushing the Tezos market cap above $2 billion.
If the bullish divergence printed on the daily chart materialises, a massive upside could see Tezos’ market cap sore even higher.
Elsewhere, the crypto market is revelling in a $1 trillion valuation, achieved as Bitcoin crossed the $37,000 mark. Several altcoins are aiming for the moon as optimism swells.
Stellar (XLM) has pumped 72% to break the $0.40 line, while under fire Ripple has also seen its XRP spike 29% in 24 hours to eye a retest of $0.30. Other double-digit moves among the top 20 cryptocurrencies by market cap are Cardano (ADA) with 25%; NEM (XEM) with 22%; EOS +15%; ChainLink (LINK) +13% and TRON (TRX) +11.8%.
XTZ/USD
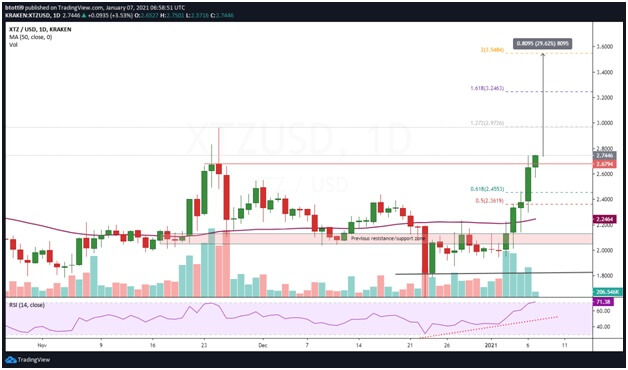
XTZ/USD daily chart. Source: TradingView
The XTZ/USD pair on the daily chart is trading near the 127.2% Fibonacci retracement level that provides a minor resistance line around $2.97. The 200% Fibonacci retracement level at $3.54 provides the next resistance line.
The Relative Strength Index (RSI) is showing a bullish divergence as it bids to cross into overbought territory. If bulls maintain the upside momentum and reach the $3.55 target, XTZ/USD will have surged by about 30% from current levels of $2.74.
On the downside, the first support zone is at the 61.8% Fibonacci level at $2.45. This is the initial reload zone, which could ease the dip to the 50-SMA at $2.23. If bears take charge and break the critical support line, XTZ/USD could drop to the previous resistance/support zone near $2.00.
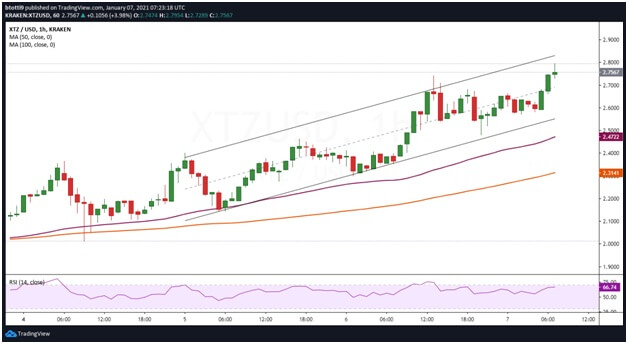
XTZ/USD 1-hour chart. Source: TradingView
On the hourly chart, XTZ price is trading inside an ascending parallel channel, with bulls looking to test resistance at the upper boundary. If the attempt fails, the middle line of the channel provides immediate support at $2.70.
As long as bulls hold above the 50-SMA ($2.47) and 100-SMA ($2.31), the likelihood of rebounding to $3.55 short term remains high. However, if the support lines at the two moving averages break, the $2.00 level will be crucial to any near term bullish/bearish plans.
https://coinjournal.net/news/tezos-xtz-looks-for-30-breakout-with-bullish-divergence/


 BTC-USD
  ETH-USD
  LTC-USD
  XRP-USD