November 26, 2020
By Benson Toti
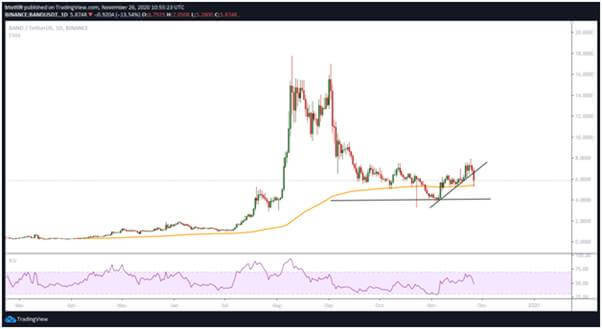
Band Protocols’ token BAND has flashed a sell signal on the daily chart to suggest sell-off pressure could push its price to $3.89
Cross-chain oracle platform Band Protocol’s token BAND is trading lower as widespread crypto sell-off bleeds most altcoins.
At the time of writing, the BAND token was trading at $5.84 and likely to head lower if bears maintain the downward pressure. The sell-off currently sees Band Protocol’s price printing the third straight red candle on the daily time-frame.
The negative outlook is even more ominous for Band Protocol bulls given the sell signal formed on the daily chart. The TD Sequential indicator suggests the current downswing is likely to push BAND/USD even lower this time. The last time the daily chart flashed the nine green candle, the token’s price crashed from highs of $17.00 to $8.00.

In addition to the bearish signal of the TD Sequential, the Relative Strength Index on the daily chart is pointing south to suggest bears still have the upper hand. Also, the token is trading below a short term rising trendline formed since early November.
The above scenario suggests that if the downward pressure holds, the next move down could be a dip to lows of $3.89.
However, bulls might still recover if they keep prices above the 200-day exponential moving average (EMA). Currently, the 200-EMA (daily time-frame) is at the $5.40 level, which is above the base that has held for the past several weeks.
As such, keeping the support zone intact should be the bulls’ primary goal if they wish to avoid more damages. As noted above, the sell signal portends doom for BAND/USD if the price breaks below the support provided by the said moving average.

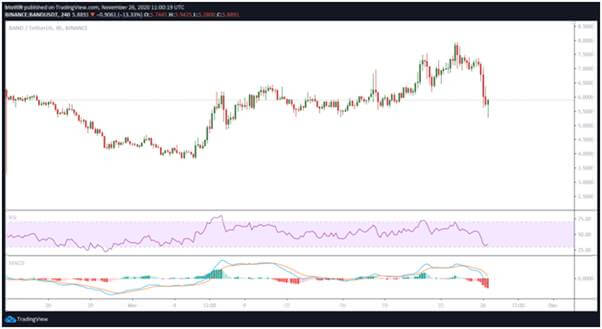
On the 4-hour chart, the RSI is climbing after flipping before hitting oversold territory. The MACD suggests a hidden bullish divergence as shown by the green candle in the last session.
This suggests that an influx of upside pressure from traders looking to buy the dip could push Band Protocol up. If this happens, the next hurdle on the upside is the 50% Fibonacci retracement ($6.70) and then 61.8% Fibonacci ($7.46) of the move from highs of $9.83 to $5.14.
https://coinjournal.net/news/price-analysis-band-dips-to-5-20-after-altcoin-sell-off/


 BTC-USD
  ETH-USD
  LTC-USD
  XRP-USD