August 5, 2020
By Benson Toti
BCH/USD faces strong resistance at $297 while ETC/USD bulls aim at retaking control above $7.35
Bitcoin price is consolidating around $11,200 as analysts forecast a slowdown in action before another upside arrives to take it to around $13,000.
The altcoin market is similarly seeing a cooling off in price action as major coins like Ethereum and XRP retreat to support levels below $400 and $0.30 respectively.
Two other coins likely to see some sideways trading before new uptrends arrive are Bitcoin Cash and Ethereum Classic — as both seek support above crucial price levels.
Bitcoin Cash analysis
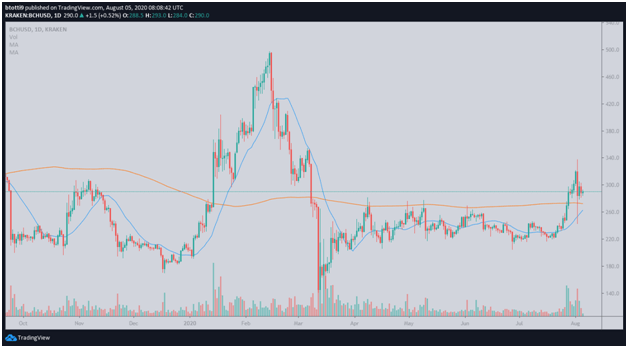
Bitcoin Cash bulls are trying to prevent a slump to price levels below $288 as bears appear determined to seize control. On Tuesday, the price of Bitcoin Cash slipped to a low of $283 before recovering to close at $291. However, price declined 2% in early morning trading on Wednesday to exchange hands at around $288 on most major exchanges.
Price has also broken below the lower limit of a recently formed upward channel. Bulls must regain control and push prices to the upper line at $297, which acted as resistance during the last session.
If prices fall further, support levels are at the SMA 200 and SMA 20 at $272.50 and $263.01 respectively. On the upside, $297 and $314 provide areas of resistance.

Ethereum Classic analysis
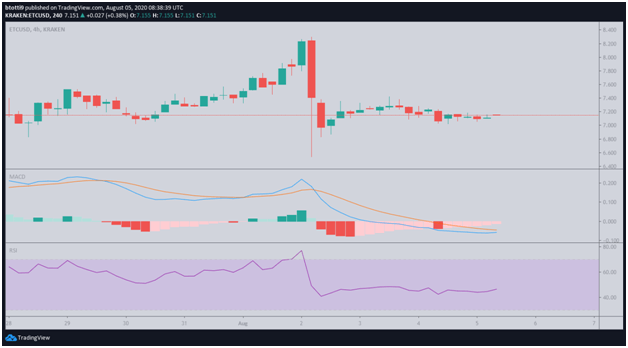
Ethereum Classic price is trading at around $7.15 at the time of writing, unchanged from its prices at close on Tuesday. The bears appear to be in control as bulls have failed to break above $7.40 on three attempts this week.
Sellers managed to push ETC/USD to lows of $6.90 last week amid a network reorg that was initially thought to have been a 51% attack. Bulls quickly pushed prices above $7.30, touching highs of $8.23 as Ethereum Classic rallied alongside other cryptocurrencies on Bitcoin’s jump to $12,000.

The MACD indicator on the ETC/USD 4-hour chart has formed a bearish divergence and the RSI is flatlining around 46.54. If bears manage to push prices further down, immediate support levels are at the 200-day and 20-day simple moving averages at $7.054 and $6.97 zones.
The upside might be capped at $7.40 and $7.65, above which bulls may revisit the resistance area around August 2 highs at $8.23.
https://coinjournal.net/news/bitcoin-cash-and-ethereum-classic-price-analysis/


 BTC-USD
  ETH-USD
  LTC-USD
  XRP-USD