XEM price could dip below $0.60 if bulls fail to take control short term
Holders of NEM will receive 1 XYM for each XEM token held during the Symbol airdrop
NEM price has dipped nearly 12% in the past 24 hours to touch lows of $0.59. Over the past week, the cryptocurrency’s value against the US dollar has dropped by over 25%. If the prices drop further, XEM/USD could trade plunge below $0.59 and touch prices last seen on 1 March 2021.
At the time of writing, NEM is trading at $0.63 but with a bearish outlook on the 4-hour chart. The token could be set for a few drab days even as the community inches closer to the Symbol (XYM) airdrop.
According to the team behind NEM, the previously postponed airdrop will occur on 15 March, with a snapshot of the blockchain scheduled for 12 March. During the token giveaway, those who opt-in will receive 1 XYM token for every XEM token they hold.
Among exchanges that have announced support for the airdrop are Poloniex, Gate.io, and Bitpanda.
XEM/USD

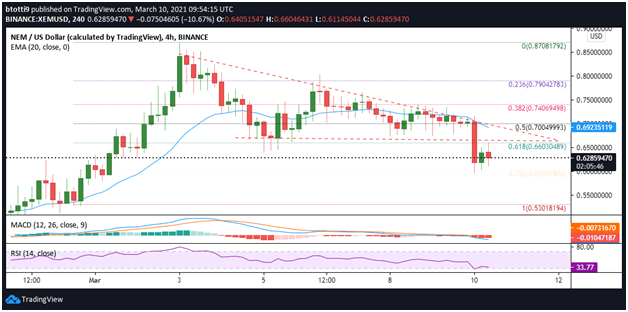
NEM has failed to recover above $0.66, the 0.618 Fibonacci retracement level of the swing from $0.53 low to $0.87 high. This is after a sharp sell-off saw prices decline below the support line of a descending triangle pattern on the 4-hour chart.
Bulls need to push higher and breach the resistance at the above price level to retake control. That would put XEM/USD on course to retest the 0.5 Fibonacci retracement level ($0.70). The 20-day EMA is also currently stationed at $0.69, suggesting an upside break alongside a broader rally in the market will likely propel the pair towards the 0.382 Fib level ($0.74).
Above this, bulls could target $0.80 and the recent peak at $0.87.
On the contrary, XEM/USD could see further declines short term if the price drops below $0.60. The MACD (4-hour chart) has crossed into the bearish zone with a sloping RSI is printing oversold. While bulls may take advantage of tiring sellers, this will likely come after prices dip lower before seeing a fresh upside.

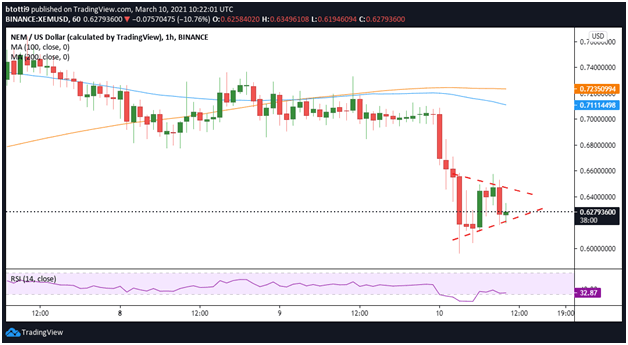
The hourly chart shows bears are largely in charge. XEM prices remain well below the 100 and 200 SMAs. There’s also a bearish flag pattern formation whose confirmation would see XEM/USD dip towards the $0.60 support.
The above perspective could call for more sell orders, with the added pressure forcing bulls to defend gains near the previous support zone at $0.53.
https://coinjournal.net/news/nem-xem-price-retraces-by-12-despite-symbol-airdrop/


 BTC-USD
  ETH-USD
  LTC-USD
  XRP-USD