Stellar (XLM) price jumped more than 42% to rise towards $0.45 before aggressive selling pushed it lower
The price of XLM has retreated after increasing over 42% in the past 24 hours. Downward pressure over the past few hours has seen XLM/USD slip. At the time of writing, XLM/USD is trading around $0.33, but bulls appear to have the upper hand.
Stellar’s price is likely to go up as the broader crypto market is seeing an uptick in sentiment.
Bitcoin, which has traded sideways for much of the week, has jumped 15% in the past hour to trade above $37,300. Ethereum (ETH) is also up 6% on the hour and 9% on the day to see bulls eye $1,400. The rest of the top 10 coins are also trending green, with Dogecoin (DOGE) having dropped to the 12th spot after an overnight pump that saw it rank 9th.
If XLM mirrors the positive outlook currently with most of the top altcoins, a higher close on the daily log could catalyse further gains. Contrary to that, a drop to a major support zone could be on the cards.
XLM/USD technical outlook
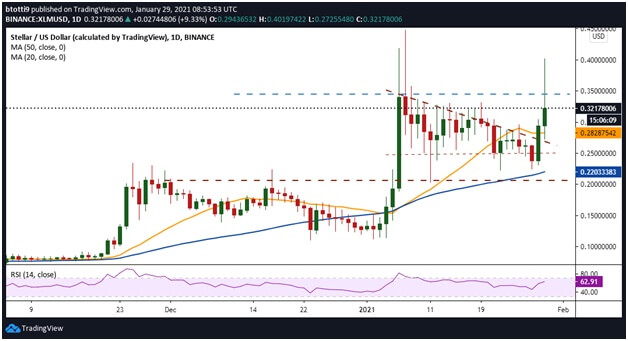
Stellar broke above a descending triangle pattern and established support at the 20-day simple moving average. Another leg higher saw it reach intraday highs of $0.41 and come close to retesting the highs of $0.447 reached on 7 January 2021.
Noticeably, sentiment remains bullish as indicated by the RSI and MACD. The daily RSI is above 61 and looking to turn higher, while the MACD remains in the positive zone and shows a hidden bullish divergence as selling pressure weakens.
XLM/USD daily price chart. Source: TradingView
On the flip side, failure to push XLM/USD above $0.35 could continue to attract sellers and see the price dip to $0.28 (20-SMA support). Increased profit-booking from traders that had also brought the dip to $0.11 lows on 23 December last year might then aid the downturn to the recent floor at $0.23. The 50-day SMA could protect recent gains around $0.22.
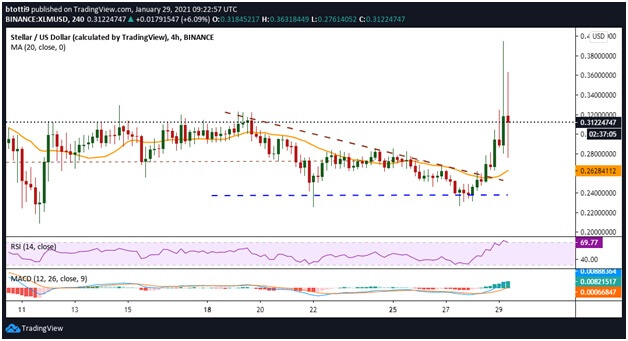
XLM/USD 4-hour chart. Source: TradingView
The above scenario will strengthen if the bullish outlook suggested by the MACD and RSI on the 4-hour chart flips negative. While the MACD indicator suggests momentum is with the bulls, the 4-hour RSI is positive but slightly dipped near the overbought territory.
If sentiment changes and the pair drops to $0.26 (both the 20-SMA and 50-SMA on the 4-hour chart are logged here), the next support zone is at $0.23.
Likely, bulls will look to bounce off this level with aggressive buying and thus resume higher. However, if the rebound tapers off again with prices beneath the moving averages, another correction could take XLM/USD to lows of $0.20.
https://coinjournal.net/news/stellar-price-analysis-xlm-sees-0-41-after-a-massive-42-upswing/


 BTC-USD
  ETH-USD
  LTC-USD
  XRP-USD