November 20, 2020
By Benson Toti
Bitcoin Cash will surge to $300 against the US dollar if bulls break and hold momentum above $260
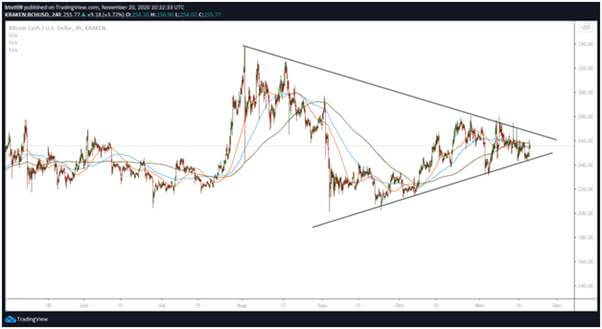
The price of Bitcoin Cash (BCH) could rally towards its August 2020 peak if bulls manage to break above a resistance line formed on 2 August.
At the time of writing, the cryptocurrency is trading at $256, up about 5% in the past 24 hours.
Should bulls maintain the upward action, they are likely to push prices above the upper line of a symmetrical triangle pattern. The line has presented a major barrier to the upside since BCH/USD dropped from highs of $337 to lows of $206.
BCH/USD has over the past several days consolidated near the base of the pattern, between $250 and $260. However, bulls need a clear breakout above $260 and aim to hold prices above the triangle. This should invite more buy orders that could push BCH to $300.
Bitcoin Cash price chart

BCH price 4-hour chart. Source: TradingView
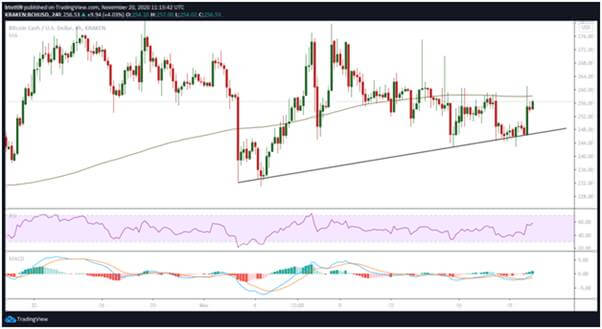
BCH is trading above the 50-SMA and 100-SMA on the 4-hour chart and could yet grow higher. The 200-SMA ($258) is however, above the price at the time of writing to suggest bulls face some resistance beneath $260.
But the overall bullish outlook for this coin is strengthened by the upturned RSI trending above the midpoint. This scenario, plus a daily close above the upper trendline, will re-energise bulls and provide the impetus needed to push higher.

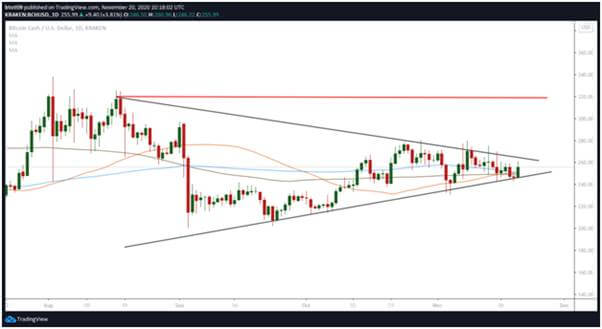
The daily chart indicates that Bitcoin Cash is trading above the 50-SMA, 100-SMA and 200-SMA. If bulls hold prices above the three moving averages, currently resident near $254, the short-term outlook will remain bullish. In this case, it is possible that increased buying pressure could see BCH price retest the $270 and $280 resistance levels.
Although the $280 supply zone could likely provide a stiffer challenge to the bulls, a successful breakout here brings into play the $300 hurdle.

On the downside, if the $250 supply zone crumbles under increased sell-off pressure, the next major support area is at $240. An extended trading period below the symmetrical triangle pattern could provide the bearish setup needed to push BCH price to lows of $200.
https://coinjournal.net/news/bch-on-track-for-300-amid-growing-bullish-momentum/


 BTC-USD
  ETH-USD
  LTC-USD
  XRP-USD