Bitcoin (BTC) price has crossed above $47,000 and could eye a fresh rally towards a new all-time peak above $58k
Bitcoin price has gained over 5% in the past 24 hours, trading at highs of $47,400 as strong buying pressure pushes it further above the major support level found at $46,700.
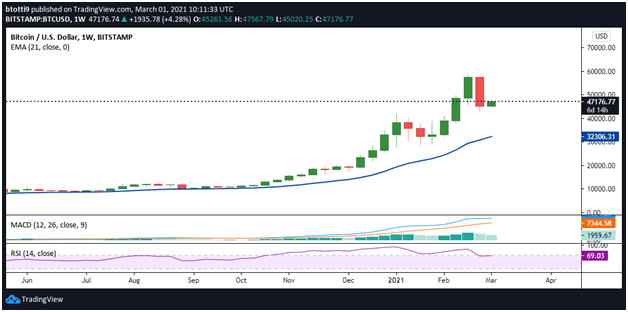
Bitcoin weekly chart
The weekly close for Bitcoin (BTC) completed a bearish pattern that saw prices decline from highs of $58.4k to lows of $43k.
As the weekly chart shows, there was a bearish engulfing pattern with the long red candlestick. BTC/USD thus closed at its lowest price level since the first week of February.
Despite the losses, the weekly RSI and MACD remained strongly in favour of bulls. The RIS is suggesting bulls are in control as it trends towards the 70 mark, while the MACD remains above the signal line.
A continuation of the strong start to the week could hence invalidate the previous week’s bearish outlook and set BTC/USD towards new highs.

Bitcoin daily chart outlook
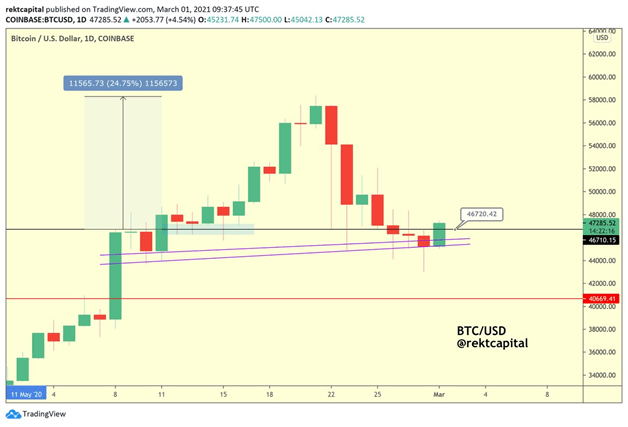
The daily chart shows that BTC/USD is trading just below the 20-day EMA ($47,593). If bulls establish support above the EMA, a higher close near the horizontal resistance line at $50k would invite more buyers.
If bulls hold above $46,700, chances of a stronger upside are there. According to crypto trader and analyst Rekt Capital, BTC/USD could rally 24% if buyers keep prices above the aforementioned support level.
“The last time #BTC turned the ~$46700 level into support on the Daily… $BTC rallied +24% to new All Time Highs Chances are that turning this level into a support once again would open price up to at least a decent rebound #Bitcoin,” the analyst has pointed out.

Bitcoin price 4-hour chart
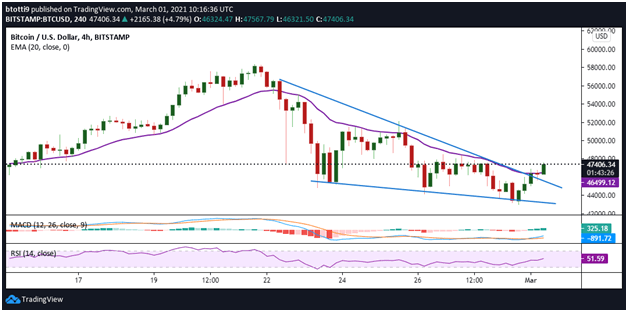
The positive outlook for BTC/USD follows a break above a short-term falling wedge pattern on the 4-hour chart. The technical picture also includes a bullish divergence for the RSI and MACD, with the formation of a Three White Soldiers candlestick pattern reinforcing a short-term bearish reversal trend.
The three white soldiers pattern is a bullish candlestick pattern analysts use to pinpoint a potential downtrend reversal. The BTC/USD 4-hour chart shows the formation of the three consecutive green candles with successive highs.

If bulls strengthen above the 20-day EMA ($46,644), further gains could push Bitcoin’s price towards the psychological $50,000 level. A fresh influx of buy-side pressure could suggest a continuation of the bull run, with price targets near the all-time peak of $58,400 likely.
On the downside, lack of upside conviction from the bulls could see BTC/USD retrace towards immediate support in the $46,700-$46,500 range. Further losses could pull the pair to the support line at $45,000, with further anchors at $42k and $40k.
https://coinjournal.net/news/bitcoin-looks-to-climb-above-47k-after-bearish-weekly-close/


 BTC-USD
  ETH-USD
  LTC-USD
  XRP-USD