ETH is trading lower within a symmetrical triangle that has capped prices below $600
Ethereum has failed to rally despite the positive sentiment that followed the launch of the ETH 2.0 upgrade. The cryptocurrency’s price has dropped from highs of $640, with support around $530. The lack of major moves on the upside for Ethereum comes after the overall crypto market hit a pause in the latest bull run after Bitcoin’s rejection near $20,000.
The short-term technical perspective for ETH/USD suggests a bearish trend. However, if the market responds with an influx of buying pressure, bulls could break higher and recoup recent losses below $640. Accumulation above this level within the coming days could allow bulls to target $700.
ETH/USD technical outlook
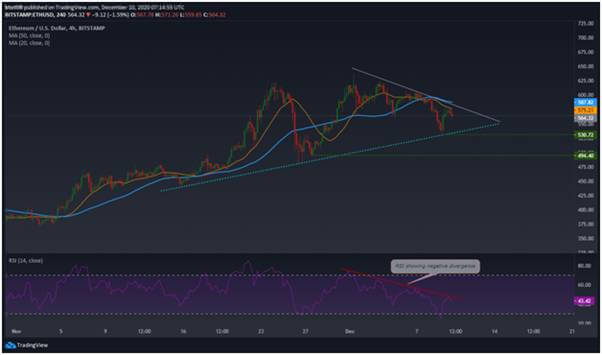
Ethereum’s price action over the past few days has consisted of undecided moves within a symmetrical pattern.
After breaking below $600 earlier in the week, ETH price breached the 50-SMA support wall before finding an anchor near $536.
ETH/USD 4-hour chart. Source: TradingView
Yesterday, ETH/USD declined by 7% to touch lows of $530. Although bulls responded aggressively as shown by the series of higher green candles, their attempts failed at the 20-SMA.
The RSI indicator currently reads 43 and is showing a negative divergence to suggest bears might not be done yet. If there’s a breakdown below the triangle support, Ethereum’s price might drop to $490, with further negative action taking it to around $450.
On the upside, the 20-SMA ($575) and the 50-SMA ($587) offer resistance areas that might thwart a clear breakout above the triangle. In this case, bulls must first turn the barriers into support levels and target a higher close above $600 to flip the advantage from the bears.
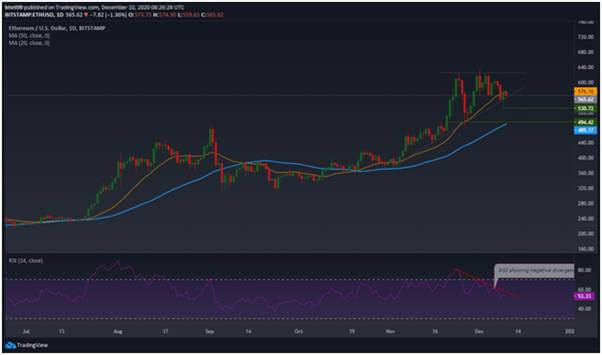
On the daily chart, ETH/USD is trading just above the trendline of an ascending triangle pattern. The 20-SMA ($576) provides immediate resistance, with the price likely to continue down as suggested by the downsloping RSI.
ETH/USD daily chart. Source: TradingView
If bears manage to push prices lower, the ETH/USD pair might decline to $530 and then the 50-SMA ($489).
On the contrary, keeping prices above the trendline may allow bulls to push higher. If the price ticks up past the 20-SMA (immediate resistance level), the main target will be $600.
Beyond this hurdle, possibly via a few days of range-bound trading, a breakout above the horizontal resistance line could put Ethereum price above $700.
https://coinjournal.net/news/ethereum-price-eth-usd-capped-within-a-triangle-pattern/


 BTC-USD
  ETH-USD
  LTC-USD
  XRP-USD