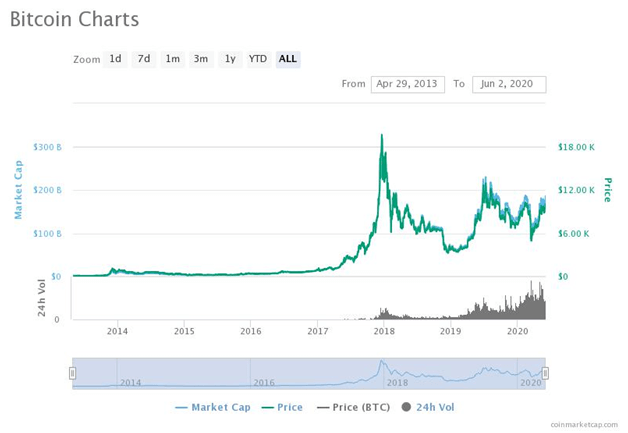
Bitcoin is exchanging hands above $10,000, but the Energy Value indicator suggests price is overvalued and another dip is very likely
Bitcoin’s Energy Value indicator screaming “overvalued”
The Energy Value indicator shows that Bitcoin’s last bull market was preceded by a correction that came after the values of this indicator also dipped. The same scenario is probable at the moment as conditions are similar, some say.
The last time Bitcoin hit a major correction before the 2017 bull run, the Energy Value indicator signalled the top cryptocurrency was tremendously overpriced.
Now the signal is back, and as argued by Charles Edwards, Bitcoin is overvalued in the same way for the first time since September 2019.
Bitcoin overvalued for first time since September 2019 per Energy Value.
Good news?
When EV bottoms and trends up, it is often a BIG up trend. Particularly after halving.
We are already getting signs of daily EV greater than price. If this continues, expect fast recovery. pic.twitter.com/lEU0n8knmM
— Charles Edwards (@caprioleio) June 1, 2020
Ordinarily, the signal signifies that a bearish trend is on the cards, but when the Energy Value bottoms post halving, its upside coincides with a spike in Bitcoin price. The uptrend has historically continued until the indicator and the leading cryptocurrency’s price top out.
According to Charles Edwards, from Digital asset management firm, Capriole, the EV is set to bottom, but an uptrend “is often a BIG” one. The analyst points out that although the asset is overvalued, uptrends following halvings have in the past come with quick price recoveries.
As per the Energy Value signal, Bitcoin’s price might yet experience a post-halving crash. The EV is bottoming and the price might have to follow as it happened in the aftermath of the asset’s last halving in 2016.

At the time, Bitcoin’s post-halving price crossed under the EV about a week after the block reduction event that cut miner rewards from 25 bitcoins to 12.5 bitcoins. Price crashed approximately three weeks after the event, setting Bitcoin back 27% from a high of $770, down to lows of $550. However, the cryptocurrency embarked on a major rally as the bull market took prices to all-time highs.
The current crossunder has been 17 days in the making, meaning that prices could also tank in the next few days. If a similar trajectory takes shape, a 27% price drop could see Bitcoin decline to levels below $8,000 — with technical analysis indicating support on the descending triangle is at $7,400.
If we follow the Energy Value model, in comparison with hash rate drops, then the price drops from highs of $10,000 today to lows of $7,400 could bring it to lose around 25% from the top.
Miners have begun to hold onto their assets after a sell-off in the past week saw them cash out more than they generated.
Bitcoin’s cross below the Energy Value and a potential price crash could be the last opportunity to buy the dip before the next bull market hits.
https://coinjournal.net/news/energy-value-indicator-signals-bitcoin-bulls-are-not-out-of-the-woods-yet/


 BTC-USD
  ETH-USD
  LTC-USD
  XRP-USD